
KCPE Examination Essential Statistics.
2021-KCPE-EXAMINATION-ESSENTIAL-STATISTICSDownload
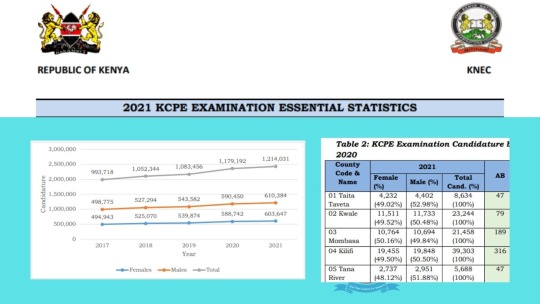
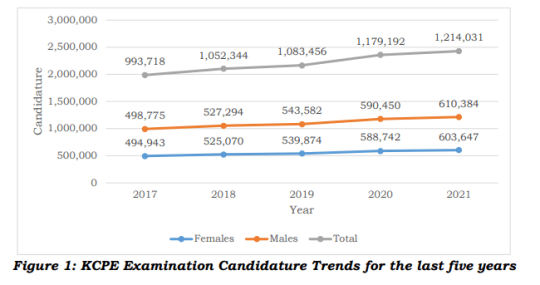
2021 KCPE Examination Candidature Trends for the last five Years.
YearTotal CandidatureFemalesMalesNo.
RegisteredTotal No. SatIncrease/
Decrease (%)No.
RegisteredNo. Sat (%)Increase/
Decrease (%)No.
RegisteredNo. Sat (%)Increase/
Decrease (%)20211,225,5541,214,03134,839
(2.95%)609,258603,64714,905
(2.47%)616,296610,38419,934
(3.27%)20201,191,6161,179,19295,736
(8.84%)595,180588,74248,868
(9.25%)596,436590,45046,868
(8.62%)20191,088,9861,083,45631,112
(2.96%)542,610539,87414,804
(2.82%)546,376543,58216,288
(3.09%)20181,060,7111,052,34458,626
(5,90%)529,273525,07030,127
(6.09%)531,438527,29428,519
(5.72%)20171,003,443993,71851,697
(5.49%)499,914494,943
(49.81%)26,425
(5.64%)503,529498,775
(50.19%)25,272
(5.34%)KCPE Examination Essential Statistics.
KCPE Examination Essential Statistics.
KCPE Examination Candidature by County for years 2021 & 2020
County Code & Name2021AB2020ABFemale
(%)Male (%)Total
Cand. (%)Female
(%)Male (%)Total
Cand. (%)01 Taita4,2324,4028,634474,3574,4568,81353Taveta(49.02%)(52.98%)(100%)(49.44%)(50.56%)(100%)02 Kwale11,51111,73323,2447911,49511,00222,49774(49.52%)(50.48%)(100%)(51.10%)(48.90%)(100%)0310,76410,69421,45818910,32510,21320,538201Mombasa(50.16%)(49.84%)(100%)(50.27%)(49.73%)(100%)04 Kilifi19,45519,84839,30331619,84719,36839,215356(49.50%)(50.50%)(100%)(50.61%)(49.39%)(100%)05 Tana2,7372,9515,688472,7762,9205,69663River(48.12%)(51.88%)(100%)(48.74%)(51.26%)(100%)06 Lamu1,7931,8673,660301,6771,6453,32225(48.99%)(51.01%)(100%)(50.48%)(49.52%)(100%)078,9009,31818,2182249,1149,62618,740170Nyandarua(48.85%)(51.15%)(100%)(48.63%)(51.37%)(100%)08 Nyeri8,1898,48316,672578,5168,65917,17578(49.12%)(50.88%)(100%)(49.58%)(50.42%)(100%)096,8026,94313,7451967,1187,22714,345154Kirinyaga(49.49%)(50.51%)(100%)(49.62%)(50.38%)(100%)1013,24213,63226,87423213,56513,76027,325160Murang’a(49.27%)(50.73%)(100%)(49.64%)(50.36%)(100%)11 Kiambu21,73121,78943,52033121,43721,57043,007276(49.93%)(50.07%)(100%)(49.85%)(50.15%)(100%)1219,88320,11639,99926419,10619,67438,780207Machakos(49.71%)(50.29%)(100%)(49.27%)(50.73%)(100%)13 Kitui21,31821,44742,76531521,00421,05242,056283(49.85%)(50.15%)(100%)(49.94%)(50.06%)(100%)14 Embu8,0758,18816,2631718,1338,16716,300101(49.65%)(50.35%)(100%)(49.90%)(50.10%)(100%)15 Meru20,03619,19239,22864419,71218,02237,734420(51.08%)(48.92%)(100%)(52.24%)(47.76%)(100%)162,9663,0305,996532,7472,9185,66541Marsabit(49.47%)(50.53%)(100%)(48.49%)(51.51%)(100%)17 Isiolo2,0881,9654,053262,0811,8653,94635(51.52%)(48.48%)(100%)(52.74%)(47.26%)(100%)KCPE Examination Essential Statistics.
County Code & Name2021AB2020ABFemale
(%)Male (%)Total
Cand. (%)Female
(%)Male (%)Total
Cand. (%)18 Makueni17,59518,01835,61318917,51017,47234,982130(49.41%)(50.59%)(100%)(50.05%)(49.95%)(100%)19 Tharaka6,5306,40512,935686,4876,25012,73737Nithi(50.48%)(59.52%)(100%)(50.93%)(49.07%)(100%)20 Nairobi35,21233,62068,83286333,90132,27366,1741105(51.16%)(48.84%)(100%)(51.23%)(48.77%)(100%)21 Turkana6,9529,49016,4425896,6229,21115,833429(42.28%)(57.72%)(100%)(41.82%)(58.18%)(100%)222,4402,8545,294632,3782,6635,04175Samburu(46.09%)(53.91%)(100%)(47.17%)(52.83%)(100%)23 Trans15,54615,65531,20152414,90515,07029,975329Nzoia(49.83%)(50.17%)(100%)(49.72%)(50.28%)(100%)24 West8,0078,29116,2984548,0528,23216,284374Pokot(49.13%)(50.87%)(100%)(49.45%)(50.55%)(100%)25 Bomet14,73214,92629,6588614,10813,90028,00881(49.67%)(50.33%)(100%)(50.37%)(49.63%)(100%)26 Uasin14,59914,47429,07322614,14414,10728,251164Gishu(50.21%)(49.79%)(100%)(50.07%)(49.93%)(100%)27 Nakuru29,11329,19458,30756128,19628,33256,528470(49.93%)(50.07%)(100%)(49.88%)(50.12%)(100%)28 Kericho14,74314,85129,5948514,21414,47328,68781(49.82%)(50.18%)(100%)(49.55%)(50.45%)(100%)29 Nandi14,87415,23330,10718914,15314,40328,556131(49.40%)(50.60%)(100%)(49.56%)(50.44%)(100%)30 Laikipia6,2206,34212,5621066,0486,15712,205103(49.51%)(50.49%)(100%)(49.55%)(50.45%)(100%)31 Kajiado11,95611,96023,91629510,89511,33422,229330(49.99%)(50.01%)(100%)(49.01%)(50.99%)(100%)32 Narok15,50016,42231,92221614,84615,46630,312261(48.56%)(51.44%)(100%)(48.98%)(51.02%)(100%)33 Baringo8,9289,44118,3691228,8369,40718,243100(48.60%)(51.40%)(100%)(48.44%)(51.56%)(100%)34 Elgeyo8,1617,91716,078587,7337,41115,14443Marakwet(50.76%)(49.24%)(100%)(51.06%)(48.94%)(100%)35 Busia14,50913,92928,43826414,00613,29027,296173(51.02%)(48.98%)(100%)(51.31%)(48.69%)(100%)3628,32427,03055,35468228,03427,30055,334480Bungoma(51.17%)(48.83%)(100%)(50.66%)(49.34%)(100%)KCPE Examination Essential Statistics.
County Code & Name2021AB2020ABFemale
(%)Male (%)Total
Cand. (%)Female
(%)Male (%)Total
Cand. (%)3733,78032,24466,02458332,79631,03963,835453Kakamega(51.16%)(48.84%)(100%)(51.38%)(48.62%)(100%)38 Vihiga10,1229,72519,84713110,1459,34019,48597(51.00%)(49.00%)(100%)(52.07%)(47.93%)(100%)39 Kisumu17,43317,05134,48425616,91016,47133,381222(50.55%)(49.45%)(100%)(50.66%)(49.34%)(100%)40 Kisii19,23019,26338,49323118,98618,42137,407231(49.96%)(50.04%)(100%)(50.76%)(49.24%)(100%)41 Homa18,54718,86237,40934517,92918,03635,965303Bay(49.58%)(50.42%)(100%)(49.85%)(50.15%)(100%)42 Siaya16,49716,09732,59423915,56714,96030,527178(50.61%)(49.39%)(100%)(50.99%)(49.01%)(100%)43 Nyamira9,3219,50818,829789,0979,25418,35155(49.50%)(50.50%)(100%)(49.57%)(50.43%)(100%)44 Migori17,63517,86535,50036217,00516,98433,989462(49.68%)(50.32%)(100%)(50.03%)(49.97%)(100%)45 Garissa4,0146,26110,2753073,9555,9039,858290(39.07%)(60.93%)(100%)(40.12%)(59.88%)(100%)46 Wajir2,6943,7086,402402,4763,4615,93760(42.08%)(57.92%)(100%)(41.70%)(58.30%)(100%)472,3224,0626,384902,2153,6765,891100Mandera(36.37%)(63.63%)(100%)(37.60%)(62.40%)(100%)Total609,258616,2961,225,55411,523595,180596,4361,191,61612,424(49.71%)(50.29%)(100%)(0.94%)(49.94%)(50.05%)(100%)(1.04%)
2021 and 2020 KCPE Examination Centres by County
County Code and NameNumber of Examination Centres20212020PublicPrivateAllPublicPrivateAll1.01
Taita Taveta206
(0.73%)33
(0.12%)239
0.84%199
(0.70%)33
(0.12%)232
(0.82%)2.02
Kwale377
(1.33%)89
(0.31%)466
1.65%369
(1.30%)85
(0.30%)454
(1.60%)3.03
Mombasa95
(0.34%)297
(1.05%)392
1.38%95
(0.33%)312
(1.10%)407
(1.43%)4.04
Kilifi520
(1.84%)160
(0.57%)680
2.40%521
(1.83%)171
(0.60%)692
(2.43%)5.05
Tana River138
(0.49%)14
(0.05%)152
0.54%137
(0.48%)14
(0.05%)151
(0.53%)6.06
Lamu89
(0.31%)12
(0.04%)101
0.36%89
(0.31%)12
(0.04%)101
(0.35%)7.07
Nyandarua340
(1.20%)95
(0.34%)435
1.54%339
(1.19%)109
(0.38%)448
(1.57%)8.08
Nyeri380
(1.34%)114
(0.40%)494
1.74%389
(1.37%)126
(0.44%)515
(1.81%)9.09
Kirinyaga198
(0.70%)121
(0.43%)319
1.13%197
(0.69%)131
(0.46%)328
(1.15%)10.10
Murang’a505
(1.78%)114
(0.40%)619
2.19%504
(1.77%)126
(0.44%)630
(2.21%)11.11
Kiambu456
(1.61%)400
(1.41%)856
3.02%458
(1.61%)418
(1.47%)876
(3.08%)12.12
Machakos841
(2.97%)227
(0.80%)1,068
3.77%837
(2.94%)241
(0.85%)1,078
(3.79%)13.13
Kitui1248
(4.41%)119
(0.42%)1,367
4.83%1,225
(4.30%)119
(0.42%)1,344
(4.72%)14.14
Embu382
(1.35%)111
(0.39%)493
1.74%380
(1.34%)118
(0.41%)498
(1.75%)15.15
Meru725
(2.56%)258
(0.91%)983
3.47%717
(2.52%)277
(0.97%)994
(3.49%)16.16
Marsabit132
(0.47%)34
(0.12%)166
0.59%131
(0.46%)38
(0.13%)169
(0.59%)17.17
Isiolo85
(0.30%)34
(0.12%)119
0.42%81
(0.28%)39
(0.14%)120
(0.42%)
County Code and NameNumber of Examination Centres20212020PublicPrivateAllPublicPrivateAll18.18
Makueni884
(3.12%)82
(0.29%)966
3.41%871
(3.06%)88
(0.31%)959
(3.37%)19.19
Tharaka Nithi399
(1.41%)63
(0.22%)462
1.63%401
(1.41%)65
(0.23%)466
(1.64%)20.20
Nairobi205
(0.72%)849
(3.00%)1,054
3.72%205
(0.72%)878
(3.09%)1,083
(3.81%)21.21
Turkana261
(0.92%)52
(0.18%)313
1.11%256
(0.90%)53
(0.19%)309
(1.09%)22.22
Samburu120
(0.42%)10
(0.04%)130
0.46%117
(0.41%)9
(0.03%)126
(0.44%)23.23
Trans Nzoia359
(1.27%)188
(0.66%)547
1.93%355
(1.25%)201
(0.71%)556
(1.95%)24.24
West Pokot472
(1.67%)47
(0.17%)519
1.83%477
(1.68%)51
(0.18%)528
(1.86%)25.25
Bomet634
(2.24%)178
(0.63%)812
2.87%621
(2.18%)199
(0.70%)820
(2.88%)26.26
UasinGishu462
(1.63%)251
(0.89%)713
2.52%463
(1.63%)261
(0.92%)724
(2.54%)27.27
Nakuru700
(2.47%)328
(1.16%)1,028
3.63%689
(2.42%)354
(1.24%)1043
(3.66%)28.28
Kericho513
(1.81%)223
(0.79%)736
2.60%510
(1.79%)238
(0.84%)748
(2.63%)29.29
Nandi723
(2.55%)136
(0.48%)859
3.03%708
(2.49%)142
(0.50%)850
(2.99%)30.30
Laikipia264
(0.93%)58
(0.20%)322
1.14%255
(0.90%)57
(0.20%)312
(1.10%)31.31
Kajiado393
(1.39%)258
(0.91%)651
2.30%384
(1.35%)255
(0.90%)639
(2.25%)32.32
Narok625
(2.21%)144
(0.51%)769
2.72%601
(2.11%)141
(0.50%)742
(2.61%)33.33
Baringo580
(2.05%)69
(0.24%)649
2.29%583
(2.05%)73
(0.26%)656
(2.30%)34.34
Elgeyo Marakwet384
(1.36%)62
(0.22%)446
1.58%379
(1.33%)63
(0.22%)442
(1.55%)
County Code and NameNumber of Examination Centres20212020PublicPrivateAllPublicPrivateAll35.35
Busia430
(1.52%)84
(0.30%)514
1.82%422
(1.48%)89
(0.31%)511
(1.80%)36.36
Bungoma768
(2.71%)217
(0.77%)985
3.48%765
(2.69%)224
(0.79%)989
(3.48%)37.37
Kakamega895
(3.16%)175
(0.62%)1,070
3.78%878
(3.09%)183
(0.64%)1,061
(3.73%)38.38
Vihiga380
(1.34%)40
(0.14%)420
1.48%380
(1.34%)46
(0.16%)426
(1.50%)39.39
Kisumu612
(2.16%)140
(0.49%)752
2.66%611
(2.15%)144
(0.51%)755
(2.65%)40.40
Kisii700
(2.47%)255
(0.90%)955
3.37%697
(2.45%)280
(0.98%)977
(3.43%)41.41
Homa Bay870
(3.07%)197
(0.70%)1,067
3.77%868
(3.05%)190
(0.67%)1,058
(3.72%)42.42
Siaya647
(2.29%)84
(0.30%)731
2.58%645
(2.27%)65
(0.23%)710
(2.49%)43.43
Nyamira402
(1.42%)102
(0.36%)504
1.78%403
(1.42%)110
(0.39%)513
(1.80%)44.44
Migori613
(2.17%)198
(0.70%)811
2.86%607
(2.13%)221
(0.78%)828
(2.91%)45.45
Garissa100
(0.35%)101
(0.36%)201
0.71%103
(0.36%)100
(0.35%)203
(0.71%)46.46
Wajir159
(0.56%)33
(0.12%)192
0.68%162
(0.57%)35
(0.12%)197
(0.69%)47.47
Mandera143
(0.51%)43
(0.15%)186
0.66%146
(0.51%)46
(0.16%)192
(0.67%)Total21,414
75.63%6,899
24.37%28,313
100.00%21,230
(74.60)7,230
(25.40%)28,460
(100%)
2021 and 2020 KCPE Examination Age Distribution by County
County Code & Name20212020Candidates’ Age Group12 &
Below131415 & 1617 & 1819 & AboveTotal12 &
Below131415 & 1617 & 1819 &
Above01
Taita Taveta841,4953,1293,264588748,634861,3602,9933,5457567502
Kwale1158672,75210,7866,7841,94023,244897202,7149,1317,4012,44103
Mombasa2682,8847,1598,5672,13045021,4582112,4596,9648,1082,16563104
Kilifi1401,5414,80817,67511,8353,30439,3031351,2504,86716,44112,8523,67205
Tana River2977031,1782,2651,0362095,6882435271,2542,3731,05624306
Lamu182658001,8056521203,660281827331,59366212407
Nyandarua3404,1547,3205,6986535318,2182503,7627,3056,5008576608
Nyeri1934,4497,2814,3423476016,6721634,1357,4964,9054205609
Kirinyaga2773,6854,9294,0437199213,7452353,2274,9274,7491,04216610
Murang’a5507,54910,3117,4659287126,8745756,73810,0898,5881,20512611
Kiambu52011,71920,01410,08393624843,52044611,46919,60210,1081,12625612
Machakos6167,70213,63614,7232,95336939,9995046,37811,96115,7153,82839413
Kitui8204,85610,16119,6546,40686842,7657463,5779,02520,0047,6591,04214
Embu4013,8955,2915,4261,08616416,2633153,4085,1255,6251,54528215
Meru6156,08712,30116,2563,38158839,2285854,94911,74515,9333,885637162398181,5562,4787601455,9961475901,8212,265716126
County Code & Name20212020Candidates’ Age Group12 &
Below131415 & 1617 & 1819 & AboveTotal12 &
Below131415 & 1617 & 1819 &
AboveMarsabit17
Isiolo1885449051,789542854,0531633931,0061,7375588918
Makueni8296,52511,13413,6863,09634335,6136575,2889,84914,7673,91251219
Tharaka Nithi2122,1243,8594,9831,44731012,9351801,9313,6824,7701,79737720
Nairobi1,19515,66629,83818,8112,66565768,83286014,96528,91117,9132,71780921
Turkana2971,0152,0616,2134,1012,75516,4422317802,0155,6994,0463,06222
Samburu2818111,4482,078584925,2942256061,5811,9545789723
Trans Nzoia8274,3367,99513,5543,90058931,2016243,3277,92812,9174,28289724
West Pokot9743,1634,5945,9941,35322016,2989992,6095,0605,8721,41333225
Bomet1,9325,8367,98810,7182,77940529,6581,5954,8308,41510,1042,60945526
Uasin Gishu6384,2679,15811,8142,77442229,0735123,6768,89511,3143,32852627
Nakuru1,07110,66822,26420,1923,66944358,3078189,68821,60620,0853,70663028
Kericho1,8476,6498,6739,7362,29139829,5941,4695,5408,7429,7912,51762829
Nandi4693,0107,60613,3464,70697030,1073702,5906,85712,3555,1221,26230
Laikipia1592,2454,5134,53694816112,5621281,9294,3674,69094814331
Kajiado6494,7037,4538,2592,35050223,9165883,8647,2087,6312,342597321,8065,5858,06412,3673,47862231,9221,3254,4588,81311,6493,455612KCPE Examination Essential Statistics.
County Code & Name20212020Candidates’ Age Group12 &
Below131415 & 1617 & 1819 & AboveTotal12 &
Below131415 & 1617 & 1819 &
AboveNarok33
Baringo1,3024,2915,8145,6561,14316318,3691,0133,6926,4255,7011,16424834
Elgeyo Marakwet3931,9194,2537,1372,08828816,0782661,3794,0966,8322,19937235
Busia5452,4195,20712,8176,1241,32828,4404021,8454,96111,7756,6221,69236
Bungoma3,0489,34413,71821,9916,34291155,3542,5567,31814,75321,8767,3831,44837
Kakamega1,0826,80314,83229,06911,8302,40866,0248115,44013,42727,84713,3642,94538
Vihiga1672,1395,0748,7853,07960319,8471611,7334,6678,5603,64272539
Kisumu7153,7019,24115,5444,48779634,4844673,2869,12514,7154,7621,02340
Kisii2,0767,65511,54213,5223,13056938,4941,3417,07512,25312,8363,25265041
Homa Bay1,4404,9038,90416,2165,04190537,4091,0934,0909,61314,9185,1341,11842
Siaya5072,6697,28416,1745,08987132,5943492,2366,96314,5045,4061,06943
Nyamira1,1113,9095,9066,3751,36016818,8298433,7666,0776,0541,40620644
Migori1,4715,0398,43714,9224,81082135,5001,0164,0809,30313,8724,6491,07245
Garissa3147061,3023,6632,8061,48410,2752045361,4013,4972,5401,68046
Wajir3269761,7992,4276971776,4021836441,9432,359644164472636841,4552,4341,1623866,3841714611,7052,275971308County Code & Name20212020Candidates’ Age Group12 &
Below131415 & 1617 & 1819 & AboveTotal12 &
Below131415 & 1617 & 1819 &
AboveManderaTotal33,627
(2.74%)196,973
(16.07%)354,947
(28.96%)469,338
(38.30%)141,062
(11.51%)29,607
(2.42%)1,225,554
(100%)26,378
(2.21%)168,786
(14.16%)350,272
(29.39%)456,452
(38.31%)153,643
(12.89%)36,085
(3.03%)1KCPE Examination Essential Statistics.
KCPE Examination Overall Candidates’ Performance by Range of Marks for the years 2019 to 2021
Standard Mark RangeYear and Candidature202120202019NumberPercentageNumberPercentageNumberPercentage1.400 – 50011,8570.97%8,0910.68%9,6730.89%2.300 – 399315,27525.72%282,09023.67%242,82122.30%3.200 – 299578,19747.18%589,02749.43%566,06951.98%4.100 – 199307,53225.09%299,67725.15%263,50024.20%5.001 – 0991,1700.10%3070.03%1,3930.13%6.Number Sat1,214,03199.06%1,179,19298.96%1,083,45699.49%7.Absent11,5230.9412,4241.04%5,5300.51%8.Total Entry (Registered Candidates)1,225,5541,191,6161,088,9869.Highest mark
(out of 500)428433440KCPE Examination Essential Statistics.
KCPE Examination Overall Candidates with Special Needs Performance by Range of Marks for the years 2019 to 2021
Standard Mark RangeYear and Candidature202120202019NumberPercentageNumberPercentageNumberPercentage1.400 – 50020.08 %90.34%110.46%2.300 – 39933713.57 %31811.89%2118.77%3.200 – 29977831.33 %89733.53%72630.16%4.100 – 1991,30252.44 %1,35650.69%1,35056.09%5.001 – 099291.17 %110.41%451.87%6.Number Sat2,44898.60%2,59196.86%2,34397.34%7.Absent351.40%843.14%642.66%8.Total Entry
(Registered Candidates)2,4832,6752,4079.Highest mark (out of
500)417420414KCPE Examination Essential Statistics.
KCPE Examination Candidates’ Range of Marks for the Prison Examination Centres for the years 2021 and 2020
Standard Mark RangeYear and Candidature20212020NumberPercentageNumberPercentage1400 – 50020.22 %–2300 – 39911913.30 %435.08%3200 – 29934538.55 %30936.52%4100 – 19929733.18 %26831.68%5001 – 09930.34 %708.27%6Number Sat76685.59%69081.56%7Absent12914.41%15618.44%8Total Entry (Registered
Candidates)8958469Highest mark (out of
500)402381KCPE Examination Essential Statistics.
2020 KCPE Examination Candidates’ Range of Marks by Age
Standard Mark Range12 and Below131415 and
1617 and
1819 and AboveTotal400-5003064,4655,9551,07547911,857300-39910,89479,781123,32886,79112,4212,060315,275200-29916,10885,131165,870240,59060,40610,092578,197100-1996,14726,05156,641137,10665,31016,277307,5320-99471112214422341151,170Sat33,502195,539352,015466,004138,41828,5531,214,031AB1251,4342,9323,3342,6441,05411,523Total33,627196,973354,947469,338141,06229,6071,225,554KCPE Examination Essential Statistics.
Candidates with Special Needs who registered for the KCPE Examination by County for the years 2021 and 2020
County Code and NameBlindLow visionPhysical
DisabilityHearing
impairedTotal20212020202120202021202020212020202120201. Taita Taveta001407081192. Kwale70991511151946393. Mombasa76199172961349574. Kilifi217121820174144745. Tana River00121515217146. Lamu0053102713347. Nyandarua0056242841033458. Nyeri007313701420249. Kirinyaga00692071313392910. Murang’a0041210111419284211. Kiambu172025165059161410810912. Machakos64141847562121889913. Kitui3171525291922546714. Embu028416281511394515. Meru912171717412923729316. Marsabit006681154291117. Isiolo012444177231618. Makueni00351140705218010219. TharakaNithi001515980241420. Nairobi301834425619108210621. Turkana54281934221118786322. Samburu00104315520823. Trans Nzoia80241725231314705424. West Pokot781414131226364025. Bomet8425162224151704526. UasinGishu001016152847295127. Nakuru5223192857018569628. Kericho158718251029376629. Nandi00141133401514626530. Laikipia004412320136831. Kajiado001212405414166682KCPE Examination Essential Statistics.
County Code and NameNo. of Candidates who took examination in
prisonsNo. of Candidates who took examination in
hospitalsTotal20212020202120202021202032. Narok722411113333. Baringo0120601834. Elgeyo Marakwet00545435. Busia0124942136. Bungoma1613718233137. Kakamega39371710564738. Vihiga03121539. Kisumu4972513548540. Kisii191835222341. Homa Bay0111611162242. Siaya1510110162043. Nyamira02838544. Migori00575745. Garissa00010146. Wajir00121247. Mandera002121Total9011,0171662381,0671,240


